How to Choose a Good Target Image for Tracking in AR - Part 4
This article is part of a series that discusses the theories and practical examples on improving AR image tracking. Please refer to Part 1 for introduction.
In this part of the series, I will introduce a tool to analyze the trackability of target images. It's completely free to use! Hope it can help you. Link here.
How does it works:
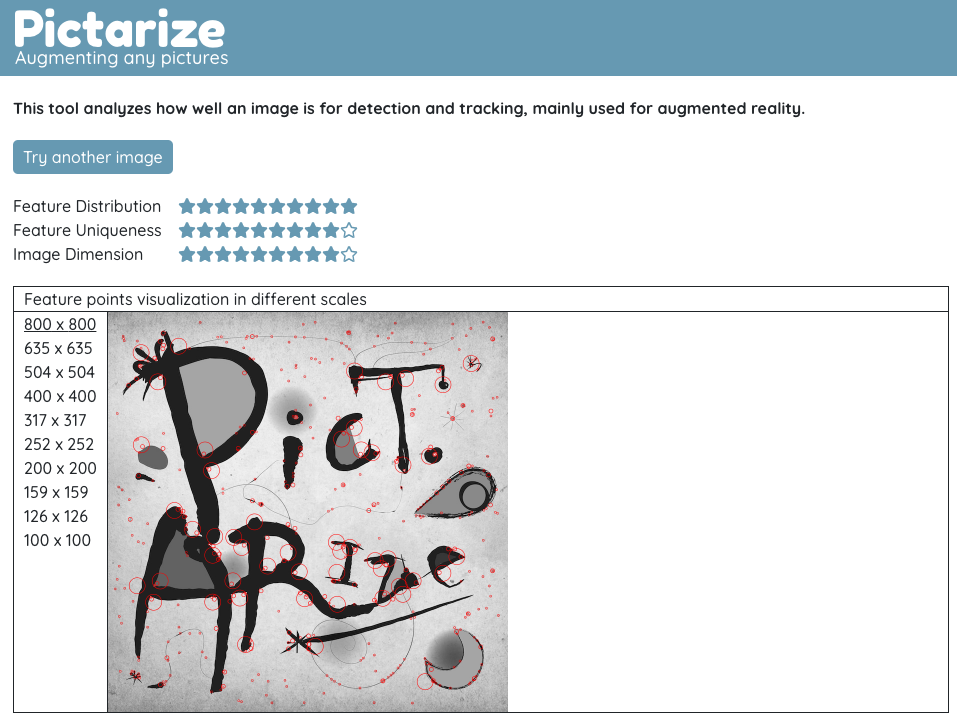
In short, the tool will try to detect feature points from your uploaded image. Then according to those detected feature points, it gives scores in 3 different aspects.
Feature Distribution
This indicates how well the feature points distribution is. More specifically, it divides the image into regions and deduct score for each empty regions.
Feature Uniqueness
The tool will try to compute the similarities between the detected feature points. The more alike, the lower the score.
Image Dimension
This one is relatively simple. The tool will give full score for image with good enough resolution (i.e. > 1000 px in each dimensions) and reasonable aspect ratio (i.e. preferably width equals height).
Feature Points Visualization
You can also visualize the detected feature points in different scales of the image. It gives you some idea on where the feature points located, so you can improve the distribution and uniqueness if necessary.
Caveat
You should only use it as a reference. Don't trust the scores blindly. That's why it is important for you to understand the reasoning behind those metrics. If you don't, check out the previous articles.
You don't need to concern too much about the exact positions of the detected feature points. In fact, every AR engines have their own detection algorithms, so they will be different anyway. You should, however, consider the overall sense of distribution.
Conclusion
Thank you for reading. If you have any feedback about the articles or the tool, please don't hesitate let me know!